Weather Alerts for Arizona
1. Excessive Heat Warning for: Aguila Valley; Northwest Valley; Tonopah Desert; Gila Bend; Buckeye/Avondale; Cave Creek/New River; Deer Valley; Central Phoenix; North Phoenix/Glendale; New River Mesa; Scottsdale/Paradise Valley; Rio Verde/Salt River; East Valley; Fountain Hills/East Mesa; South Mountain/Ahwatukee; Southeast Valley/Queen Creek; Superior; Northwest Pinal County; West Pinal County; Apache Junction/Gold Canyon; Sonoran Desert Natl Monument
2. Excessive Heat Warning for: Grand Canyon Country
3. Excessive Heat Warning for: Marble and Glen Canyons
4. Excessive Heat Warning for: San Carlos; Globe/Miami
5. Excessive Heat Warning for: Upper Gila River and Aravaipa Valleys including Clifton/Safford
6. Excessive Heat Warning for: Upper Santa Cruz River and Altar Valleys including Nogales; Upper San Pedro River Valley including Sierra Vista/Benson; Eastern Cochise County Below 5000 Feet including Douglas/Willcox
7. Excessive Heat Warning for: Western Pima County Including Ajo/Organ Pipe Cactus National Monument; Tohono O'odham Nation including Sells; Tucson Metro Area including Tucson/Green Valley/Marana/Vail; South Central Pinal County including Eloy/Picacho Peak State Park; Southeast Pinal County including Kearny/Mammoth/Oracle
8. Excessive Heat Warning for: Yavapai County Valleys and Basins
9. Excessive Heat Watch for: Upper Gila River and Aravaipa Valleys including Clifton/Safford
10. Excessive Heat Watch for: Western Pima County Including Ajo/Organ Pipe Cactus National Monument; Tohono O'odham Nation including Sells; Tucson Metro Area including Tucson/Green Valley/Marana/Vail; South Central Pinal County including Eloy/Picacho Peak State Park; Southeast Pinal County including Kearny/Mammoth/Oracle
11. Red Flag Warning for: Southern Graham-Central and Eastern Cochise-Southern Greenlee-Lower Elevations of the San Carlos Apache Nation in Graham County
Want more detail? Get the Complete 7 Day and Night Detailed Forecast!
Current U.S. National Radar--Current
The Current National Weather Radar is shown below with a UTC Time (subtract 5 hours from UTC to get Eastern Time).

National Weather Forecast--Current
The Current National Weather Forecast and National Weather Map are shown below.

National Weather Forecast for Tomorrow
Tomorrow National Weather Forecast and Tomorrow National Weather Map are show below.

North America Water Vapor (Moisture)
This map shows recent moisture content over North America. Bright and colored areas show high moisture (ie, clouds); brown indicates very little moisture present; black indicates no moisture.

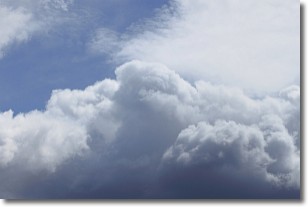
Weather Topic: What are Nimbostratus Clouds?
Home - Education - Cloud Types - Nimbostratus Clouds
 Next Topic: Precipitation
A nimbostratus cloud is similar to a stratus cloud in its formless,
smooth appearance. However, a nimbostratus cloud is darker than a stratus cloud,
because it is thicker.
Unlike a stratus cloud, a nimbostratus cloud typically brings with it the threat
of moderate to heavy precipitation. In some cases, the precipitation may evaporate
before reaching the ground, a phenomenon known as virga.
Next Topic: Precipitation
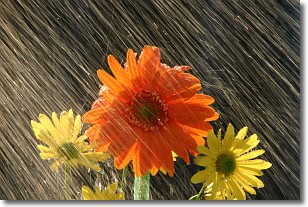
Weather Topic: What is Rain?
Home - Education - Precipitation - Rain
 Next Topic: Shelf Clouds
Precipitation in the form of water droplets is called rain.
Rain generally has a tendency to fall with less intensity over a greater period
of time, and when rainfall is more severe it is usually less sustained.
Rain is the most common form of precipitation and happens with greater frequency
depending on the season and regional influences. Cities have been shown to have
an observable effect on rainfall, due to an effect called the urban heat island.
Compared to upwind, monthly rainfall between twenty and forty miles downwind of
cities is 30% greater.
Next Topic: Shelf Clouds