Recent Worldwide Earthquakes M2.5 and Up
4.7 - Wednesday 2:32pm ET - 57 km SE of San Pedro de Atacama, Chile
3.0 - Wednesday 1:34pm ET - 24 km ENE of Koyukuk, Alaska
4.0 - Wednesday 8:11am ET - 99 km S of La Tirana, Chile
4.5 - Wednesday 7:12am ET - 115 km ESE of Petropavlovsk-Kamchatsky, Russia
2.6 - Wednesday 6:23am ET - 117 km ENE of Chignik, Alaska
2.6 - Wednesday 4:46am ET - 34 km W of Kimberley, Canada
2.9 - Wednesday 4:06am ET - 2 km N of The Geysers, CA
4.6 - Wednesday 4:06am ET - 9 km NNW of Barranco Adentro, Panama
2.5 - Wednesday 3:45am ET - 12 km WNW of Round Valley, CA
5.1 - Wednesday 2:57am ET - 151 km ESE of Labasa, Fiji
4.7 - Wednesday 2:35am ET - 68 km N of Ishigaki, Japan
5.0 - Tuesday 9:27pm ET - 114 km S of Koshima, Japan
4.2 - Tuesday 9:22pm ET - 86 km SSE of Atico, Peru
5.2 - Tuesday 9:15pm ET - 183 km WSW of Tual, Indonesia
3.7 - Tuesday 8:23pm ET - 142 km ESE of Atka, Alaska
5.0 - Tuesday 7:45pm ET - 101 km NNW of Port-Olry, Vanuatu
4.8 - Tuesday 7:19pm ET - 62 km S of Corralero, Mexico
4.0 - Tuesday 6:17pm ET - 53 km ESE of Adak, Alaska
4.6 - Tuesday 6:12pm ET - 136 km SW of Adak, Alaska
Want more detail? Get the Complete 7 Day and Night Detailed Forecast!
Current U.S. National Radar--Current
The Current National Weather Radar is shown below with a UTC Time (subtract 5 hours from UTC to get Eastern Time).

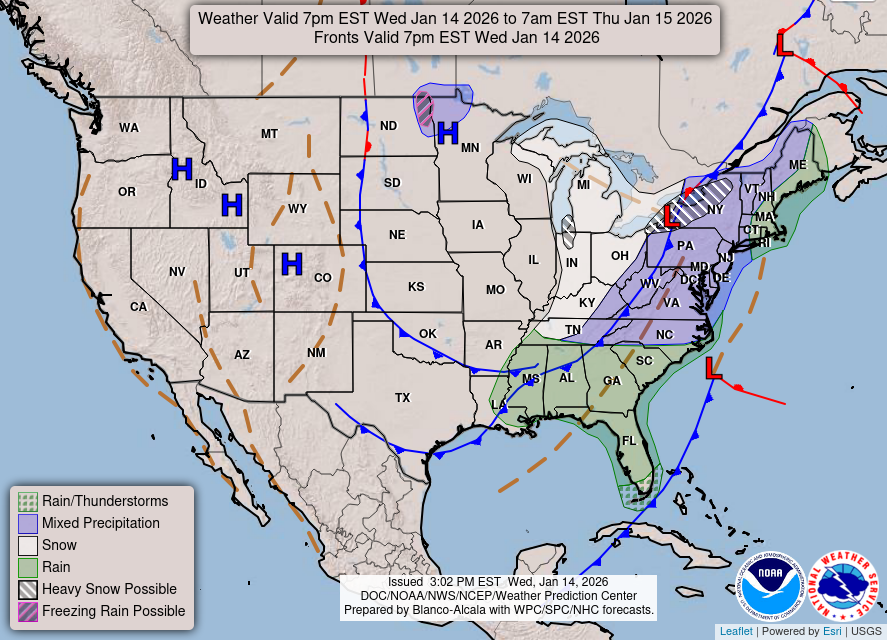
National Weather Forecast--Current
The Current National Weather Forecast and National Weather Map are shown below.

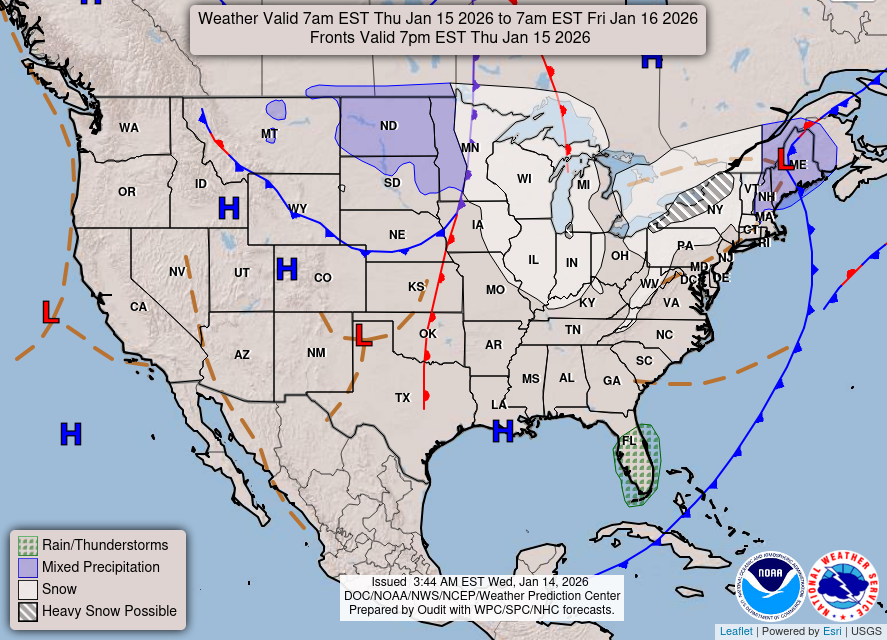
National Weather Forecast for Tomorrow
Tomorrow National Weather Forecast and Tomorrow National Weather Map are show below.

North America Water Vapor (Moisture)
This map shows recent moisture content over North America. Bright and colored areas show high moisture (ie, clouds); brown indicates very little moisture present; black indicates no moisture.

Current conditions powered by WeatherAPI.com


