Weather for the Top 250 US Cities
201. Weather for McKinney, TX
202. Weather for Concord, CA
203. Weather for Visalia, CA
204. Weather for Simi Valley, CA
205. Weather for Olathe, KS
206. Weather for Clarksville, TN
207. Weather for Denton, TX
208. Weather for Stamford, CT
209. Weather for Provo, UT
210. Weather for Springfield, IL
211. Weather for Killeen, TX
212. Weather for Abilene, TX
213. Weather for Evansville, IN
214. Weather for Gainesville, FL
215. Weather for Vallejo, CA
216. Weather for Ann Arbor, MI
217. Weather for Peoria, IL
218. Weather for Lansing, MI
219. Weather for Lafayette, LA
220. Weather for Thornton, CO
221. Weather for Athens, GA
222. Weather for Flint, MI
223. Weather for Inglewood, CA
224. Weather for Roseville, CA
225. Weather for Charleston, SC
226. Weather for Beaumont, TX
227. Weather for Independence, MO
228. Weather for Victorville, CA
229. Weather for Santa Clara, CA
230. Weather for Costa Mesa, CA
231. Weather for Miami Gardens, FL
232. Weather for Manchester, NH
233. Weather for Miramar, FL
234. Weather for Downey, CA
235. Weather for Arvada, CO
236. Weather for Allentown, PA
237. Weather for Westminster, CO
238. Weather for Waterbury, CT
239. Weather for Norman, OK
240. Weather for Midland, TX
241. Weather for Elgin, IL
242. Weather for West Covina, CA
243. Weather for Clearwater, FL
244. Weather for Cambridge, MA
245. Weather for Pueblo, CO
246. Weather for West Jordan, UT
247. Weather for Round Rock, TX
248. Weather for Billings, MT
249. Weather for Erie, PA
250. Weather for South Bend, IN
Want more detail? Get the Complete 7 Day and Night Detailed Forecast!
Current U.S. National Radar--Current
The Current National Weather Radar is shown below with a UTC Time (subtract 5 hours from UTC to get Eastern Time).

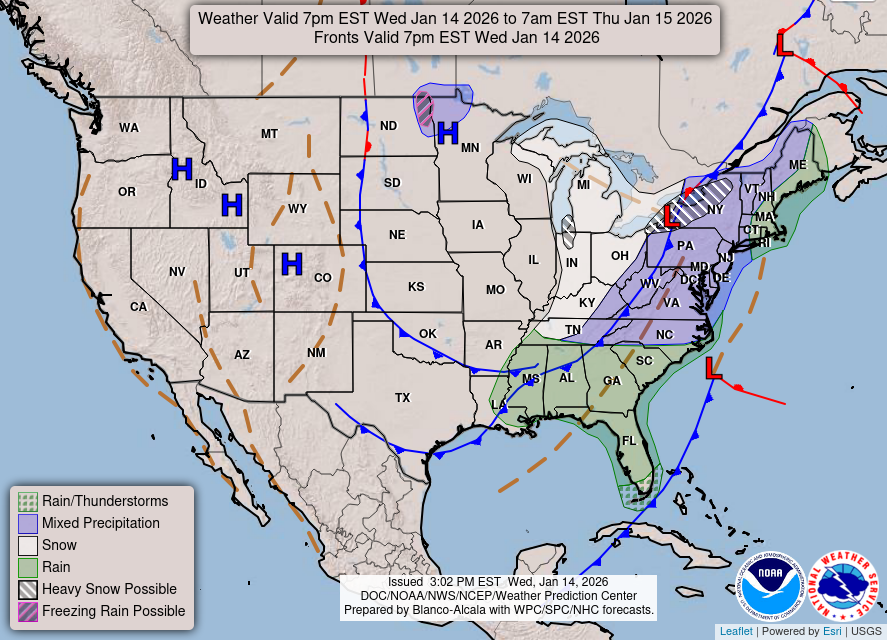
National Weather Forecast--Current
The Current National Weather Forecast and National Weather Map are shown below.
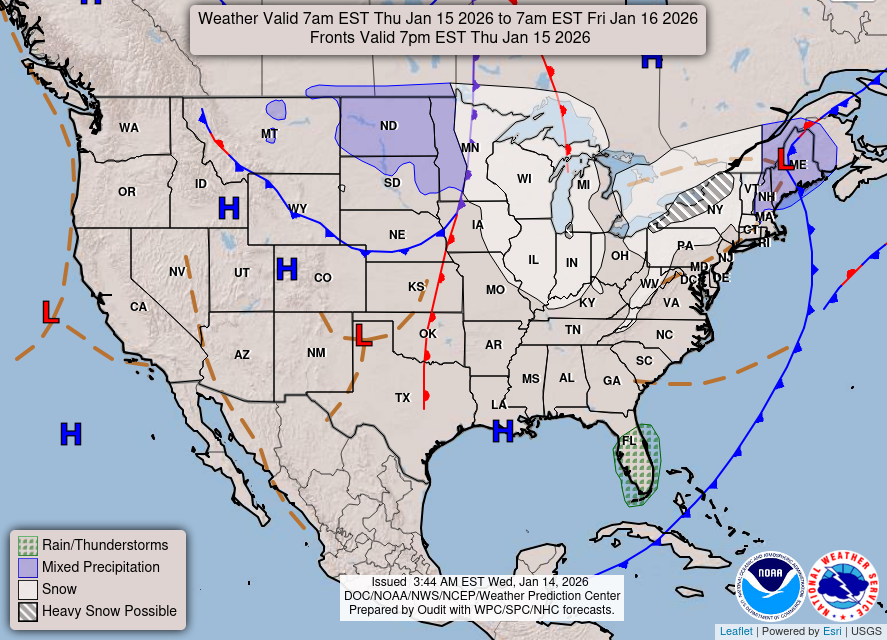
National Weather Forecast for Tomorrow
Tomorrow National Weather Forecast and Tomorrow National Weather Map are show below.
North America Water Vapor (Moisture)
This map shows recent moisture content over North America. Bright and colored areas show high moisture (ie, clouds); brown indicates very little moisture present; black indicates no moisture.